Seeing the Unseen: How Handheld Infrared Thermal Imagers Reveal a Hidden World
Update on April 14, 2025, 6:13 a.m.
Have you ever stood baffled by a mysteriously cold spot on your living room wall, even on a warm day? Or perhaps worried about a phone charger that feels alarmingly hot to the touch? Our eyes, marvelous as they are, are tuned only to a narrow band of light, the visible spectrum. But all around us, an invisible world pulses with energy – the energy of heat. Imagine, for a moment, if you could see this hidden landscape of temperatures. This isn’t science fiction; it’s the reality offered by infrared thermal imagers, fascinating tools that translate heat into visible images.
Once confined to military applications and high-tech labs, handheld thermal imagers are increasingly accessible. But with accessibility comes a bewildering array of options and specifications. Let’s embark on a journey together, demystifying this technology, understanding how it works, what the numbers really mean, and how you can use this knowledge to potentially diagnose problems or simply explore the thermal world around you – armed with understanding, not just a gadget.

The “Glow” of Heat: A Brief on Infrared Radiation
Think about a blacksmith’s forge, where metal heats up, first glowing dull red, then orange, then yellow-white. What you’re seeing is the visible light emitted due to intense heat. But here’s the secret: everything with a temperature above the coldest possible point (absolute zero, or -459.67°F / -273.15°C) emits energy, even if it’s not hot enough to glow visibly red. This invisible energy is called infrared (IR) radiation. It’s essentially light with a longer wavelength than our eyes can detect, occupying a different part of the electromagnetic spectrum. You feel intense infrared radiation as heat, like the warmth radiating from a stovetop burner even before it glows red.
A thermal imager acts like a specialized camera. Instead of capturing visible light reflected off objects, its lens focuses the invisible infrared radiation emitted by objects onto a sophisticated sensor. This sensor doesn’t “see” in the way our eyes do; it measures the intensity of the incoming infrared energy, pixel by pixel. The imager’s internal processor then takes these measurements and translates them into a visual map, typically using colors or shades of gray to represent different temperatures. This resulting image, called a thermogram, is what you see on the device’s screen – a vibrant, sometimes surreal, picture of the temperature landscape.

Decoding the Thermal Image: Pixels Painting Temperatures
Looking at a thermal image is like gaining a superpower, but interpreting it correctly requires understanding the tool’s capabilities and limitations. Two factors are absolutely crucial: resolution and emissivity.
Resolution: The “Eyesight” of Thermal Imagers – Why Pixels Matter Immensely
Imagine trying to recognize a friend’s face from a picture made of only a few dozen large blocks of color. You might make out the general shape, but the details – the curve of their smile, the sparkle in their eyes – would be lost. This is analogous to thermal imager resolution.
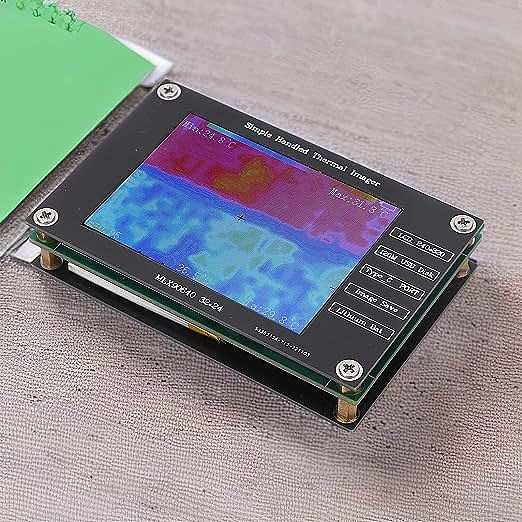
Thermal resolution refers to the number of actual sensor pixels capturing infrared data. You might see specifications like 24x32 pixels, as found in some very basic entry-level models (like the sensor type MLX90640 used in the Zunate example). This means the sensor grid has only 24 pixels across and 32 pixels down, totaling just 768 thermal data points.
What does this practically mean? A 24x32 resolution image is extremely blocky. It might be sufficient to detect large-scale temperature differences, like a significant draft under a door, a whole section of missing wall insulation, or a severely overheating appliance as a whole. However, it lacks the detail needed for many common diagnostic tasks. You likely wouldn’t be able to:
- Pinpoint a small air leak around a window frame.
- Identify a specific overheating component on a circuit board.
- Distinguish subtle temperature variations indicating moisture behind a wall unless it’s a very large, pronounced area.
- See much detail on objects that are farther away.
More capable (and typically more expensive) imagers offer higher resolutions like 160x120 (19,200 pixels) or 320x240 (76,800 pixels). The difference is night and day – like comparing a blurry pixelated image to a reasonably clear photograph. Higher resolution provides sharper images, reveals finer details, and allows you to identify smaller thermal anomalies from a greater distance.
A Critical Warning: Display Resolution vs. Thermal Resolution
Pay close attention here! Some imagers boast a display screen resolution (e.g., 240x320 pixels) that is much higher than their thermal sensor resolution (e.g., 24x32 pixels). This does not mean the thermal image quality is higher. It simply means the low-resolution thermal data is being stretched or interpolated to fit a nicer-looking screen. The actual detail captured is still limited by the thermal sensor. Always look for the thermal resolution specification – that’s what truly defines the imager’s ability to “see” thermal detail.
Behind these pixels lies the sensor technology, often a microbolometer array. In simple terms, each tiny pixel in the array absorbs incoming infrared radiation, which causes its temperature to change slightly. This temperature change alters the pixel’s electrical resistance. The imager measures these resistance changes across the entire array and converts them into the temperature data used to build the final image.
The “Honesty” of Measurement: Why Emissivity Matters
Imagine two cups, one made of matte black ceramic and the other of shiny polished metal, both filled with equally hot coffee. If you pointed even an accurate thermal imager at them without any adjustments, the reading from the ceramic cup would likely be much closer to the actual coffee temperature than the reading from the shiny metal cup. Why? The answer lies in emissivity.
Emissivity is a measure of how effectively a surface radiates thermal energy compared to a perfect theoretical “blackbody” radiator (which has an emissivity of 1.0). It’s a value between 0 and 1.
- High emissivity surfaces (close to 1.0): Materials like dull paint, concrete, wood, skin, and non-glossy plastics are very efficient at radiating their own heat. Thermal imagers measure these surfaces relatively accurately by default.
- Low emissivity surfaces (close to 0): Shiny, reflective materials like polished metal, aluminum foil, or even glossy paint are poor emitters. Much of the infrared radiation an imager detects from these surfaces is actually reflected heat from surrounding objects (including the imager itself!), not the object’s true temperature.
This is why a crucial feature on any thermal imager intended for reasonably accurate temperature measurement is adjustable emissivity, often specified with a range like 0.1 to 0.99. This allows you to tell the imager what kind of surface you’re looking at. By inputting the correct (or approximate) emissivity value for the material, the imager can compensate and provide a much more accurate temperature reading. Without adjusting emissivity, readings from low-emissivity surfaces can be wildly inaccurate. Many imagers come with built-in tables or allow manual input. Looking up emissivity values for common materials online is often necessary for precise work.
Quick Reference (Approximate Emissivity Values): * Human Skin: ~0.98 * Concrete, Brick, Wood (unpainted): ~0.90 - 0.95 * Matte Paint (most colors): ~0.90 - 0.95 * Water: ~0.96 * Glass (thick): ~0.85 (Note: Glass blocks IR, you see surface temp) * Polished Aluminum: ~0.05 - 0.10 * Polished Stainless Steel: ~0.10 - 0.15
Measuring shiny surfaces is inherently tricky, even with adjustment. Sometimes applying a piece of high-emissivity tape (like electrical tape) to the surface and measuring the tape’s temperature is a practical workaround.

Other Dials on the Dashboard: Understanding the Rest
Beyond the critical duo of resolution and emissivity, other specifications paint a fuller picture of an imager’s capabilities:
- Temperature Measurement Range: This tells you the span of temperatures the device can detect (e.g., -40°C to 300°C / -40°F to 572°F). This particular range is quite wide, suitable for everything from checking freezers to looking at moderate heat sources in cars or electronics.
- Accuracy: Often stated as something like ±2°C or ±2% of reading (whichever is greater), usually within a specific operating temperature and object temperature range (e.g., center area, 0-100°C). This gives you an idea of the potential measurement error. For simple comparative tasks (“is A hotter than B?”), high accuracy is less critical than for precise temperature monitoring.
- Refresh Rate: Measured in Hertz (Hz), this is how many times per second the image updates. A lower refresh rate like 8Hz (as in the example) means the image updates 8 times per second. This is generally acceptable for looking at static scenes but can feel slightly choppy or laggy when scanning an area quickly or observing moving objects. Higher refresh rates (e.g., 30Hz or 60Hz) provide a much smoother, real-time feel.
- Field of View (FOV): This describes the angle of the scene the imager captures (e.g., 75°x110°). This example FOV is very wide. A wide FOV is useful for seeing a large area up close (like scanning a whole wall in a small room). However, it means objects farther away appear much smaller in the image, making it harder to discern details on distant targets. A narrower FOV acts more like a telephoto lens, magnifying distant objects but covering less area.
- Portability & Features: Many handheld units are designed for convenience, featuring aluminum alloy bodies for durability, built-in rechargeable batteries (like a 1000mAh lithium battery with claimed ~6 hours use – though real-world use may vary), and internal memory to store images (e.g., capacity for 100 photos). A Micro USB port might be used for charging and transferring images to a computer for documentation or further analysis. Basic on-screen displays often show the center point temperature and automatically highlight the highest and lowest temperatures in the scene, which helps quickly identify potential areas of interest.
Thermal Eyes on the World: Real Applications & Realistic Expectations
So, you can see heat. What can you actually do with this superpower? Quite a lot, potentially, but your success heavily depends on the imager’s capabilities, especially its resolution.
Potential Home Diagnostics (Consider Resolution Limitations):
- Insulation Issues: Detect large areas of missing or poorly installed insulation in walls and ceilings (appearing colder in winter, hotter in summer). Low resolution might only show major defects.
- Air Leaks: Identify significant drafts around windows, doors, outlets, and vents, especially when there’s a good temperature difference between inside and outside. Small leaks will be missed by low-res imagers.
- Moisture Detection: Locate potential water leaks behind walls or ceilings. Wet areas tend to be cooler due to evaporation (unless it’s a hot water leak). Again, low resolution requires a fairly large affected area to be visible.
- Electrical Scans (Use Extreme Caution!): Overheating breakers, fuses, outlets, or connections can be a fire hazard. Thermal imagers can spot these hot spots before failure. However, working near live electricity is dangerous. This is best left to professionals. Furthermore, pinpointing a specific faulty wire or small connection requires high resolution. A low-res imager might only show a generally warm panel.
- HVAC Performance: Check for leaks in ductwork, verify radiator function, or see if vents are distributing air evenly.
Other Uses:
- Automotive: Spot overheating bearings, check radiator core for blockages (uneven temps), look for exhaust leaks (requires higher temp range).
- Electronics Hobbyists: Find overheating components on circuit boards (requires good resolution for small parts).
Crucial Reality Check: Remember, thermal imagers do not see through walls. They only measure the surface temperature of the first opaque object they encounter. An anomaly behind the wall is only detected if it causes a temperature change on the surface you are viewing. Also, reflective surfaces can trick the imager, showing reflections of hot or cold objects nearby. And finally, the level of detail and the ability to pinpoint small problems are directly tied to the thermal resolution. A 24x32 imager is a very basic exploratory tool, not a precision diagnostic instrument.
The Wisdom of Choice: Beyond the Price Tag
The allure of an affordable thermal imager is understandable. But choosing wisely means looking beyond the initial cost and understanding what you’re actually getting.
- Define Your Needs First: What problems do you really want to solve? Do you need to see fine details (electrical connections, small leaks)? Or are you just looking for major temperature differences (big drafts, large wet spots)? Your application dictates the minimum acceptable resolution. For anything beyond finding gross anomalies, you’ll likely need significantly more than 24x32 pixels.
- Prioritize Core Specs: Resolution is paramount for detail. Adjustable emissivity is essential for accuracy. Consider the required temperature range and acceptable refresh rate for your tasks.
- Look at the Whole Picture: Consider build quality, battery life, ease of use, and what accessories are included (user reviews mentioning missing chargers or instructions for some budget models are red flags for the overall package).
- Understand the Trade-offs: Entry-level imagers inevitably compromise on performance (resolution, sensitivity, refresh rate) to achieve a lower price point. Be realistic about what a budget tool can and cannot do. Sometimes, a simple IR spot thermometer (which measures temperature at a single point) might be a more cost-effective solution if you don’t need a full thermal image.
- Seek Reliable Information: Look for independent reviews (though scarce for very low-end models), compare specs carefully, and don’t be swayed by misleading marketing (like highlighting display resolution over thermal resolution).
Embarking on Your Thermal Vision Quest
Handheld infrared thermal imagers genuinely open up a new way of perceiving the world, revealing the hidden flows and concentrations of heat energy that constantly surround us. They hold the potential to be powerful tools for troubleshooting, energy saving, and simply satisfying curiosity.
However, like any powerful tool, effective use requires understanding. By grasping the fundamental science of infrared radiation and critically evaluating key specifications like thermal resolution and emissivity, you move beyond being a passive consumer and become an informed user. You learn to interpret the colorful images not just as pretty patterns, but as data-rich maps of thermal activity.
Whether you’re considering adding a thermal imager to your toolkit or simply want to understand the technology better, remember that knowledge is your most valuable asset. Approach this thermal world with curiosity, armed with understanding, and you’ll be well-equipped to truly see the unseen.