CDQL Thermal Imager Infrared Camera: See the Unseen World of Heat (-40°F to 572°F)
Update on April 24, 2025, 8:34 a.m.
Imagine stepping into a world painted not with light and shadow as we know it, but with the subtle and dramatic hues of heat itself. Picture seeing the cold draft cascading invisibly from a window frame, the hidden warmth of electricity flowing through a wire, or the ghostly thermal footprints left on a chair moments after someone stands up. This isn’t science fiction; it’s the reality offered by infrared thermography, a technology that allows us to visualize the invisible world of heat energy. While once the domain of expensive labs and specialized professionals, handheld devices are increasingly bringing this power into more hands. Let’s explore the fascinating science behind this “sixth sense” and look at how a device like the CDQL Thermal Imager Infrared Camera (based on its available product description) serves as a tangible example of its application.

Whispers from the Past: When Light Revealed More
Our journey into seeing heat begins, perhaps surprisingly, with visible light. In 1800, the astronomer Sir William Herschel was experimenting with sunlight and prisms. He aimed to measure the heat contained within different colors of the spectrum. Placing thermometers in each color band projected by the prism, he noticed something remarkable. As he moved his thermometer beyond the red end of the visible spectrum, where there was no visible light, the temperature reading climbed higher than in any of the colors. Herschel had accidentally discovered a form of invisible light carrying significant heat energy – what we now call infrared radiation. He opened a door to understanding that the universe communicates in wavelengths far beyond what our eyes can perceive.
The Universal Language of Heat: Understanding Infrared
What Herschel stumbled upon is fundamental: every object with a temperature above absolute zero (the theoretical coldest possible point, -459.67°F or -273.15°C) constantly radiates energy in the form of electromagnetic waves. This includes the chair you’re sitting on, the coffee mug on your desk, the pet sleeping at your feet, and you yourself. Much of this radiated energy falls within the infrared portion of the electromagnetic spectrum, nestled between visible light and microwaves.
Think of it like this: just as hotter objects glow brighter in visible light (like a heated stove element turning red, then orange, then yellow-white), they also “glow” brighter in infrared. The amount and peak wavelength of the infrared radiation emitted are directly related to an object’s temperature – a principle rooted in what physicists call blackbody radiation. While the physics gets complex, the core idea is simple: temperature translates into a specific infrared signature.
However, there’s a crucial twist: emissivity. Imagine two objects sitting side-by-side at the exact same temperature. One is dull black plastic, the other is shiny polished metal. Surprisingly, a thermal camera might show them at different apparent temperatures. Why? Because different materials radiate thermal energy with different efficiencies. Emissivity is a measure (from 0 to 1) of how effectively a surface emits infrared radiation compared to a perfect theoretical emitter (a “blackbody”). The dull black plastic might have an emissivity close to 0.95, meaning it radiates heat very efficiently, while the shiny metal might have an emissivity closer to 0.1, reflecting more infrared from its surroundings and emitting less of its own. Understanding emissivity is absolutely critical for accurate temperature measurement with a thermal camera. A simple thermal imager shows relative differences well, but getting precise temperature readings requires knowing or adjusting for the emissivity of the surface being viewed.

Inventing Infrared Eyes: How Thermal Cameras Capture Heat
So how do we translate this invisible infrared glow into an image we can see? That’s the job of the thermal camera sensor. While various technologies exist, many handheld imagers, including the one described in the CDQL product information (which specifies using an MLX90640 ESF BAB sensor), rely on a type of uncooled microbolometer array.
Think of a microbolometer array as a grid of incredibly tiny heat detectors, or pixels. Each pixel is coated with a material that absorbs infrared radiation. When infrared energy from the scene strikes a pixel, it warms it up ever so slightly. This minuscule temperature change alters the pixel’s electrical resistance. Sophisticated electronics measure these tiny resistance changes across the entire grid, essentially creating a map of the temperature variations detected.
This raw data, a grid of temperature-related electrical signals, is then processed by the camera’s internal circuitry. It’s often converted into a visual format where different temperature levels are represented by different colors (a “rainbow” palette is common, often with blue/purple for cold and red/yellow/white for hot) or shades of gray. This resulting visual representation of the thermal landscape is what we call a thermogram.
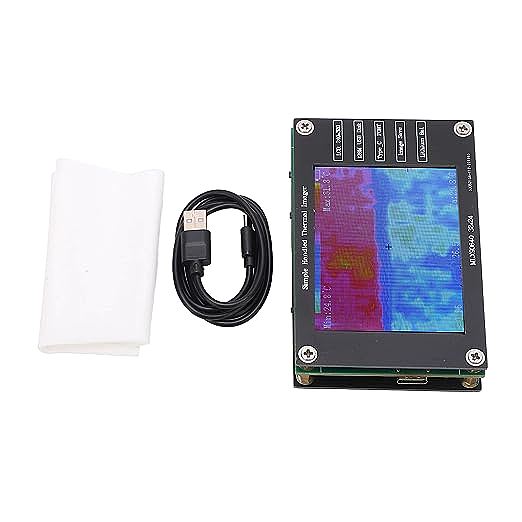
A Handheld Window to Warmth: The CDQL Imager as an Example
The advancement of microbolometer technology has paved the way for more compact and affordable thermal imagers, moving them from specialized labs into toolkits for technicians, home inspectors, engineers, and even curious hobbyists. The CDQL Thermal Imager Infrared Camera, as detailed in its product description (our sole source for its specifics, lacking external verification), exemplifies this trend. It’s described as a handheld, multifunctional device aiming to provide this thermal sensing capability. Let’s examine its listed specifications through the lens of the science we’ve just discussed.
(Disclaimer: All specific features, specifications, and performance characteristics mentioned for the CDQL device are based solely on the provided product description text. No independent verification or testing has been performed, and the source itself notes a lack of customer reviews.)

Decoding the Heat Map: Making Sense of the Features
Understanding a thermal camera’s specifications is key to interpreting the images it produces and knowing its capabilities and limitations.
Beyond Human Touch: The Temperature Range
The source states the CDQL imager measures from -40°F to 572°F (-40°C to 300°C). This is a reasonably wide range for a handheld device. The lower end allows for checking refrigeration or identifying extreme cold spots, while the upper end can handle tasks like monitoring electrical panels, checking engine components (carefully!), or inspecting moderate industrial processes. It wouldn’t be suitable for extremely high-temperature applications like furnaces, but covers many common diagnostic scenarios.
Pixel Perfect? Understanding the 24x32 Sensor & Interpolation
The heart of the image quality lies in the sensor resolution. The description specifies a 24 x 32 infrared pixel sensor. This means the raw thermal data is captured by a grid of only 768 individual points. For comparison, even a basic smartphone camera captures millions of visible light pixels. What does this low thermal resolution mean practically? It means the resulting image will inherently lack fine detail. You can spot larger thermal patterns – a cold wall section, a hot motor – but pinpointing very small hotspots or seeing intricate thermal variations will be challenging.
The device description mentions a 240 x 320 pixel LCD screen and uses “interpolation simulation display.” Interpolation is a software technique where the camera calculates intermediate pixel values between the actual sensor readings to create a larger, smoother-looking image on the higher-resolution display. This makes the image appear less blocky, but it’s crucial to understand that interpolation does not add real thermal information. It’s like enlarging a low-resolution photo – it gets bigger, but not fundamentally sharper or more detailed. The underlying thermal detail is still limited by the 24x32 sensor.
Your Thermal Dashboard: The 2-inch Screen & Data Points
The 2.0-inch screen serves as the viewfinder and display. According to the source, it shows the thermogram and helpfully tracks the maximum and minimum temperatures detected within the frame, along with the temperature at the center point. These are useful features for quickly identifying the hottest or coldest spots without needing to manually scan every pixel, speeding up diagnosis.
Capturing the Flow (or Stillness): The 8Hz Refresh Rate
Refresh rate, measured in Hertz (Hz), indicates how many times per second the thermal image is updated on the screen. The specified 8Hz means the image refreshes 8 times each second. This is generally adequate for scanning stationary objects or slowly changing thermal scenes. However, if you pan the camera quickly or try to view rapidly changing temperatures (like tracking a moving hot object), an 8Hz refresh rate might result in a slightly laggy or choppy image, potentially causing motion blur. Higher refresh rates (e.g., 30Hz or 60Hz, common in more expensive models) provide a much smoother, real-time viewing experience.
The Accuracy Question Revisited
The source claims a measurement accuracy of ± 2°C (± 3.6°F). While this provides a baseline, remember our discussion on emissivity. This stated accuracy is likely under ideal laboratory conditions, potentially assuming a high-emissivity target. In the real world, the actual accuracy achieved will heavily depend on the emissivity of the surface being measured, the distance to the target, atmospheric conditions, and potentially reflected infrared radiation from other sources. The provided description doesn’t specify if the CDQL device allows the user to adjust the emissivity setting to match the target material – a critical feature for obtaining truly accurate temperature readings rather than just observing relative thermal patterns. Without this adjustment, readings from low-emissivity surfaces (like shiny metals) could be significantly inaccurate.
Thermography in Action: Stories Told by Heat
The true value of thermal imaging lies in its application. Let’s paint a picture of how seeing heat can solve real problems:
- The Drafty Window Detective: Imagine scanning your living room wall on a cold winter day. Suddenly, near the window frame, a plume of deep blue or purple appears on the imager’s screen – a waterfall of cold air flowing down the wall. You’ve instantly visualized an air leak that’s costing you energy and comfort. Similarly, missing insulation in a wall cavity might appear as a distinctly colder rectangular patch compared to the surrounding area.
- The Glowing Circuit Breaker: You open your home’s electrical panel and scan the breakers with the thermal imager (from a safe distance, of course!). Most breakers appear near ambient temperature, but one glows significantly warmer – perhaps yellow or even orange against a cooler background. This isn’t normal. Increased electrical resistance in a faulty breaker or a loose connection causes it to heat up due to Joule heating ($P = I^2R$). Spotting this early can help prevent a potential fire hazard.
- The Leaky Duct Dilemma: Pointing the imager at your ceiling below the attic ductwork in summer, you might see cool streaks or patches indicating leaks where expensive conditioned air is escaping into the hot attic space. Checking HVAC vents, you can visually confirm if cool or warm air distribution is uniform.
- The Overworked Chip: For electronics hobbyists or repair technicians, scanning a circuit board under power can instantly reveal which components are running hot. An overheating chip might glow brightly on the thermogram, indicating potential failure or a design issue, long before smoke appears.
These scenarios highlight how thermal imaging transforms abstract problems (energy loss, electrical faults) into tangible, visual evidence, enabling faster and more accurate diagnosis.

Beyond the Lens: Practical Aspects & Considerations
A tool is only useful if it’s practical. Based on the source description:
- Built for the Field? The casing is made of FR4 sheet material. FR4 is a common, rigid fiberglass laminate used for printed circuit boards. It’s known for decent strength and electrical insulation, suggesting a focus on making the device reasonably durable for fieldwork, though perhaps not as rugged as rubber-overmolded designs.
- Capturing Evidence: The ability to store 100 pictures internally on a built-in flash chip is handy for documenting findings. You can reportedly save an image by holding a button (for >= 15s) and view/delete images directly on the device.
- Getting Images Out: A TYPE C USB interface allows connecting to a computer or phone to view and copy these image files, with the device apparently emulating a small (16MB) USB drive. This facilitates report generation or further analysis.
- Portability: Being described as small and lightweight reinforces its intended use as a portable diagnostic tool.
Accessible Vision, Understanding Limits
Handheld thermal imagers like the one described represent a significant step in making infrared technology more accessible. They offer the potential to empower homeowners, technicians, and hobbyists with a powerful diagnostic sense, revealing a hidden layer of information about the world.
However, it’s essential to approach such tools with realistic expectations, particularly those at the more accessible end of the market. The limitations imposed by lower sensor resolution (affecting detail), potentially lower refresh rates (affecting motion), and crucially, the potential lack of adjustable emissivity (affecting absolute temperature accuracy) must be understood. Effective use relies not just on pointing and shooting, but on understanding the underlying science and interpreting the thermal patterns within the context of the device’s capabilities.
Furthermore, as emphasized throughout, our specific knowledge of this CDQL device is confined strictly to its product description. Without independent testing or broader verified data, we treat it as an illustration of the types of features one might find in this category of imager.
Conclusion: Empowered by a New Way of Seeing
Sir William Herschel’s simple experiment with prisms over two centuries ago unlocked a new spectrum, forever changing how we understand energy and light. Today, technologies derived from that discovery allow us to carry devices in our pockets that grant us a form of vision he could only have dreamed of – the ability to see the intricate dance of heat that animates our world. Infrared thermography provides a unique and powerful perspective, transforming invisible energy flows into actionable insights. While every tool has its capabilities and limitations, the growing accessibility of thermal imaging empowers more of us to diagnose problems, improve efficiency, enhance safety, and simply marvel at the previously unseen thermal tapestry that surrounds us. It’s a potent reminder that reality is often richer and more complex than what meets the eye.