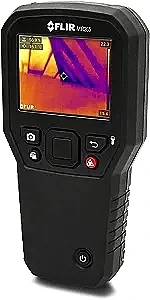
YuqiaoTime NF-522 Thermal Imager: Unveiling the Invisible World of Heat for Diagnostics & Inspection
Update on April 24, 2025, 1:50 p.m.
Take a moment and think about the world around you. Feel the warmth radiating from your morning coffee mug, the coolness of a window pane on a winter’s day, or the heat shimmering off asphalt in the summer sun. We experience temperature constantly, but what if we could see it? Not just feel it, but visually perceive the intricate tapestry of heat that surrounds us? This isn’t science fiction; it’s the reality offered by thermal imaging, a technology that translates the invisible language of heat into vibrant, informative images.
Everything in the universe warmer than the absolute coldest possible temperature (a chilling -273.15°C or -459.67°F) constantly emits energy in the form of infrared radiation. Think of it as a universal thermal signature, unique to every object’s temperature and surface properties. While our eyes are tuned to the narrow band of visible light, infrared radiation occupies a different part of the electromagnetic spectrum, with wavelengths longer than red light. Its existence was famously stumbled upon by astronomer Sir William Herschel in 1800 while experimenting with prisms and thermometers, revealing a hidden form of energy beyond the visible rainbow.
For a long time, “seeing” this infrared world was confined to specialized military and scientific applications. But technology marches on, and today, handheld devices like the YuqiaoTime NF-522 (whose specifications, provided by its manufacturer Noyafa, we’ll explore) act as powerful translators, bringing the ability to visualize heat signatures into the hands of professionals and curious individuals alike. Let’s embark on a journey to understand how these ‘heat goggles’ work and what they reveal about the hidden thermal landscape.

Whispers of Warmth: How We Capture Infrared Light
So, how does a device like the NF-522 actually “see” heat? It starts with understanding the physics of infrared radiation. The hotter an object is, the more intensely it radiates infrared energy. This relationship is governed by fundamental physics (related conceptually to Planck’s law of blackbody radiation). Furthermore, the type of infrared radiation changes with temperature.
Crucially, our atmosphere isn’t transparent to all infrared wavelengths. However, there’s a specific “atmospheric window,” primarily between 8 and 14 micrometers (µm), where infrared radiation travels relatively unimpeded. This Long-Wave Infrared (LWIR) band is precisely what most terrestrial thermal imagers, including the NF-522 according to its specs (8-14um spectral response), are designed to detect. It’s the perfect window for observing temperatures common on Earth, from icy landscapes to operating machinery.
The heart of a thermal imager is its detector, acting like the retina of an eye, but sensitive to heat instead of light. Many modern handheld imagers utilize a technology called a microbolometer array. Imagine a grid of incredibly tiny sensors, each smaller than a human hair. When infrared radiation from the scene strikes these micro-sensors, they warm up slightly. This warming causes a measurable change in their electrical resistance. The camera’s electronics rapidly scan this grid, detecting these minute resistance changes across thousands of points.
This raw electrical data, essentially a map of temperature differences, is then processed by sophisticated algorithms within the camera. This processing converts the signals into a visual image – the thermogram – that we see on the display. Different temperatures are assigned different colors or shades of gray according to the selected color palette, creating an intuitive visual representation of the heat distribution across the scene.

Painting with Heat Pixels: Resolution, Sensitivity & Speed
The quality and usefulness of the thermal image depend heavily on the camera’s core specifications. Let’s look at what the numbers mean for the NF-522, based on its provided data:
- Thermal Resolution (200x150 pixels): Think of this as the number of “heat pixels” the detector has. The NF-522 captures a thermal image composed of 200 rows and 150 columns, totaling 30,000 individual temperature measurement points. Just like with a regular digital camera, more pixels generally mean a sharper, more detailed image. In thermography, this translates to the ability to distinguish smaller temperature differences or identify issues on smaller components from a distance. A higher resolution might reveal a single overheated connection within a crowded circuit board, whereas a lower resolution might only show a general warm area.
- Visible Light Companion (640x480 pixels): Alongside its thermal eye, the NF-522 includes a standard visible light camera. With 300,000 pixels, it captures a familiar visual image of the scene. This isn’t just for show; it’s the indispensable partner for context, especially when using advanced features like image fusion, which we’ll discuss later. It helps answer the critical question: “Where exactly is that hot spot located?”
- Thermal Sensitivity (NETD 65mK): This is arguably one of the most crucial specs, indicating how well the camera can distinguish between very small temperature differences. NETD stands for Noise Equivalent Temperature Difference, measured in milliKelvins (mK). Imagine trying to hear a faint whisper in a quiet room – that’s analogous to a camera with good sensitivity detecting subtle heat variations. 65mK means the NF-522 can theoretically discern temperature differences as small as 0.065°C (0.117°F). This level of sensitivity is vital for applications like detecting hidden moisture (which often creates subtle cooling effects due to evaporation) or identifying minor insulation defects that might otherwise go unnoticed.
- Frame Rate (9Hz): This indicates how many times per second the thermal image updates on the screen. 9Hz (9 frames per second) is a common specification for many thermal imagers sold commercially worldwide, partly due to international export regulations and cost considerations. While it won’t provide the buttery-smooth motion of a video camera, it’s generally perfectly adequate for most inspection tasks, such as scanning walls, checking electrical panels, or observing machinery operating under steady conditions.
Getting the Numbers Right: Temperature Range & The Emissivity Enigma
A thermal imager doesn’t just show heat patterns; it’s also a non-contact thermometer. Two factors heavily influence its measurement capabilities:
- Wide Temperature Range (-40°F to 626°F / -40°C to 330°C): The NF-522 boasts a broad measurement range, according to its specifications. This versatility allows it to tackle diverse tasks. You could use it to pinpoint freezing drafts below 0°F (-18°C) around a poorly sealed door, and then turn around and measure the surface temperature of an engine component running well above the boiling point of water. This wide span makes it adaptable for various diagnostic needs, from HVAC checks to automotive work.
-
The Emissivity Imperative (Adjustable 0.1-1.0): This is perhaps the most critical concept for achieving accurate temperature measurements with any thermal imager. Emissivity is a property of a material’s surface that describes how efficiently it radiates thermal energy compared to a theoretical “perfect radiator” (a blackbody, with emissivity 1.0). Think of it like a surface’s “willingness” or “ability” to thermally express itself. Different materials have vastly different emissivities. For example, a piece of black electrical tape (emissivity around 0.95) is very efficient at radiating heat, while shiny, bare metal (emissivity perhaps 0.1 or lower) is a poor radiator.
Why does this matter? Because the thermal imager detects the total infrared energy coming from a surface. If you point it at two objects at the exact same temperature, but one has high emissivity and the other has low emissivity, the high-emissivity object will appear much hotter to the camera because it’s radiating more effectively. Therefore, to get an accurate temperature reading, you must tell the camera the emissivity value of the surface you are measuring. The NF-522 allows you to adjust this setting from 0.1 to 1.0. Failing to set the correct emissivity is the single most common cause of inaccurate temperature readings in thermography. Looking up common emissivity values for different materials is standard practice.
It’s also important to note that accuracy can be influenced by factors like distance to the target, atmospheric conditions (humidity, air temperature), and reflected infrared radiation from other objects (especially problematic with low-emissivity surfaces, which act like thermal mirrors). The NF-522’s manual mentions its accuracy testing conditions (ambient temp 25°C, distance 0.3M), implicitly acknowledging that real-world results depend on proper use and awareness of these factors.
Decoding the Heat Map: Modes, Palettes, and Fusion
Seeing the heat map is one thing; interpreting it effectively is another. The NF-522 provides several tools to aid in this process:
- Viewing Modes (Infrared, Edge Detection, Dual Light Fusion):
- The Standard Infrared mode displays the pure thermal image.
- Infrared Edge Detection cleverly overlays the outlines of significant thermal gradients onto the visible image. This can help orient you, showing where the edges of hot or cold objects lie within the normal visual scene.
- Dual Light Fusion is often the most powerful interpretive tool. This technology intelligently blends the thermal image information with the image from the standard visible camera. The NF-522 manual describes adjustments for alignment and zoom, allowing you to precisely overlay the thermal data onto the corresponding physical object. The value here is immense: instead of just seeing a vague hot area, fusion lets you identify exactly which component – a specific wire, connection, or section of pipe – is exhibiting the thermal anomaly. It bridges the gap between the thermal world and the physical world.
- Color Palettes (9 options): While black-and-white (‘grayscale’ or ‘ironbow’) palettes are often excellent for detailed analysis, color palettes (like ‘Rainbow’) can make certain thermal patterns pop, quickly drawing attention to the hottest or coldest areas. Different palettes excel in different situations; for instance, a high-contrast palette is great for emphasizing extreme temperature differences. The NF-522 offers multiple options (White Hot, Black Hot, Rainbow 1 & 2, Purple, Orange, Iron Gray, High Temp High Contrast, High/Low Temp High Contrast), giving the user flexibility to choose the best visualization for the task. They are analytical aids, not just decoration.
- On-Screen Guides (Center, Max/Min): The display provides immediate quantitative feedback: the temperature at the center targeting point, plus automatically identified maximum (red dot) and minimum (green dot) temperatures within the current view. These are handy for quick spot checks and understanding the range of temperatures present.
The Thermal Detective at Work: Real-World Scenarios
Armed with the ability to see and measure heat, what problems can we actually solve? The applications are vast, turning the user into a kind of ‘thermal detective’:
- The Home Inspector’s Ally: Imagine scanning an exterior wall on a cold evening. The NF-522’s thermal view instantly reveals darker (colder) patches where insulation is missing or compressed (heat escaping via conduction). Streaks of cold air appearing around a window frame pinpoint energy-wasting drafts (convection). Inside, scanning near the ceiling after a rainstorm might reveal a subtly cool, damp area invisible to the naked eye – a potential roof leak detected early thanks to the camera’s sensitivity (65mK). Checking the electrical panel might show one breaker significantly warmer than the others, indicating a potential overload or failing component (leveraging the temperature range). Plumbing issues can sometimes be traced by following the temperature differences in pipes hidden behind walls.
- The Mechanic’s Insight: Pointing the NF-522 at a running engine can help diagnose issues like uneven cylinder temperatures or exhaust manifold leaks. A radiator showing uneven heat distribution might indicate a blockage. A brake caliper glowing significantly hotter than its counterpart after driving could signal a sticking piston. Even verifying that heated seats are functioning correctly becomes a quick visual check.
- The Predictive Maintenance Edge: In industrial or even home workshop settings, regularly scanning critical equipment like motors, bearings, or electrical connections can reveal components running hotter than normal. This elevated temperature is often a precursor to failure. Catching these issues early using thermal imaging allows for maintenance before a costly breakdown occurs – the core idea behind Predictive Maintenance (PdM).
- Other Documented Uses: The NF-522’s manufacturer also lists applications like assisting in firefighting investigations (seeing through smoke to find hot spots or victims), maintaining historical buildings, finding air conditioning leaks, and even searching for pests like termites (which can create subtle heat signatures).
In each case, the thermal imager provides data that was previously inaccessible, allowing for faster, more accurate diagnostics and preventative action.
Capturing the Evidence: Documenting Thermal Discoveries
Finding a problem is only part of the solution; often, you need to document it. The NF-522 addresses this by allowing users to capture both still thermal images (saved in BMP format) and record video clips. According to the packing list and specifications, it includes an 8GB memory card and supports up to 16GB MiniTF cards, providing ample space for storing findings from multiple inspections. This capability is invaluable for creating reports, comparing conditions before and after repairs, tracking changes over time, or simply sharing observations with colleagues or clients.

Embracing a New Way of Seeing
Thermal imaging technology, embodied in accessible tools like the YuqiaoTime NF-522 (based on its manufacturer-provided specifications), fundamentally extends our senses. It peels back the veil of visible light to reveal a dynamic world of heat flow, energy transfer, and hidden thermal signatures. It transforms abstract concepts like heat loss or electrical resistance into tangible, visual data, empowering us to move beyond guesswork towards informed, data-driven decisions.
Whether you’re a homeowner trying to make your house more energy-efficient, a DIYer troubleshooting a car problem, or a professional performing critical inspections, the ability to “see” heat offers a powerful advantage. It fosters a deeper understanding of how things work (and fail) and enables proactive steps towards safety, efficiency, and prevention. The YuqiaoTime NF-522, with its documented blend of imaging capabilities, measurement tools, and interpretive features, serves as a concrete example of how this once-exclusive technology is becoming increasingly available.
However, the true power lies not just in the tool, but in the user. Understanding the principles behind the image – especially the critical role of emissivity – and learning to interpret the thermal patterns correctly are paramount. As we continue to develop and utilize these remarkable devices, we embark on an ongoing journey of discovery, constantly learning to better read the subtle, informative, and often beautiful language of the thermal world around us.


