Seeing the Unseen: A Homeowner’s Guide to Thermal Diagnostics & Leak Detection
Update on Nov. 28, 2025, 12:19 p.m.
For decades, the structural health of a home was largely a matter of guesswork. To find a water leak, you often had to wait for the drywall to crumble; to find an electrical fault, you waited for a breaker to trip—or worse, smoke to appear.
Today, accessible thermal imaging technology has democratized “preventative maintenance.” By visualizing infrared radiation, homeowners can now perform non-destructive testing (NDT) typically reserved for industrial engineers. However, owning a thermal camera is only half the battle; knowing how to interpret what you see is the true skill.
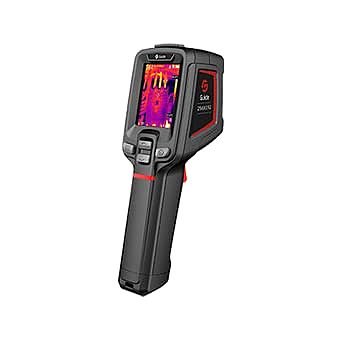
This guide explores the principles of thermal diagnostics, using high-resolution devices like the PerfectPrime IR0019 as a case study to demonstrate how pixel count and sensitivity translate into actionable home repairs.

The Resolution Reality: Why Pixels Matter
When selecting a diagnostic tool, the most critical specification is IR Resolution. This is distinct from the resolution of the standard digital camera often paired with the thermal sensor.
Many entry-level devices on the market offer resolutions of 60x60 or 80x60 pixels. While sufficient for checking a fuse box at close range, these low-resolution sensors produce “blob-like” images where details blur together. This phenomenon is known as the “Spot Size Ratio”—if the sensor lacks enough pixels, it cannot accurately measure the temperature of a small target (like a distant pipe crack) because the target is smaller than a single pixel.
The PerfectPrime IR0019 illustrates the tier where diagnostic capability significantly increases. With a sensor resolution of 320x240 pixels, it generates 76,800 individual temperature data points per image. To put this in perspective: * 80x60 sensor: 4,800 data points. * 320x240 sensor: 76,800 data points.
This 16-fold increase in data density allows users to distinguish individual studs behind a wall, identify specific overheating components on a dense circuit board, or trace the exact path of a radiant floor heating wire.

Decoding the Spectrum: Practical Applications
Understanding the colors on a thermal screen—known as a thermogram—requires a basic grasp of physics. Thermal cameras do not “see” water or cold air; they detect the temperature difference (Delta T) caused by these elements.
1. Water Leak Detection: The Evaporative Cooling Effect
One of the most valuable applications for a device like the IR0019 is locating hidden moisture. When water seeps into drywall or insulation, it slowly evaporates. This evaporation process consumes heat energy, causing the wet area to appear cooler than the surrounding dry material.
- What to look for: On your thermal display (typically using a high-contrast palette like “Iron” or “Rainbow”), moisture often appears as amorphous, dark blue or purple splotches.
- Gravity’s Signature: A leak originating from a roof or upper pipe will often create a triangular shape, widening as the water flows downward.
2. Electrical Audits: Identifying Resistance
In electrical systems, resistance creates heat. A loose connection, a corroded wire, or an overloaded breaker will restrict electron flow, generating a distinct thermal signature.
- The Safety Advantage: Using a handheld imager allows you to scan an electrical panel from a safe distance.
- Interpretation: Look for “hotspots”—bright red or white areas—that are significantly warmer than neighboring components under similar load. A breaker that is 15°F (8°C) hotter than the one next to it warrants immediate professional attention.
3. Insulation and Air Sealing
Thermal bridging occurs where insulation is missing or compressed, allowing heat to escape (in winter) or enter (in summer).
- Scan Technique: The best time to scan for insulation gaps is when there is a significant temperature difference (at least 20°F) between the inside and outside of the house.
- Visuals: Wall studs act as thermal bridges and will appear as vertical stripes. Irregular dark patches between these stripes usually indicate settled or missing fiberglass batts.

The “Emissivity Trap”
A common pitfall for new users is emissivity. This refers to a material’s ability to emit infrared energy. Organic materials (wood, skin, drywall) have high emissivity (~0.95) and are easy to read. However, shiny metals (copper pipes, aluminum ducts) have low emissivity—they act like “thermal mirrors,” reflecting the heat of the room (or your body) rather than showing their own true temperature.
The Pro Tip: If you need to measure a shiny copper pipe, wrap a piece of black electrical tape around it. The tape has high emissivity. Aim your camera at the tape, and you will get an accurate reading of the pipe underneath. The IR0019 includes adjustable emissivity settings (0.1 to 1.0), allowing advanced users to calibrate the device for specific materials, ensuring the accuracy of the +/- 2.5°C readings.
Merging Visible and Thermal Worlds
Pure thermal images can sometimes be disorienting; a blue blob on a wall might be hard to pinpoint once you put the camera down. Modern diagnostics bridge this gap using Image Blending.
The IR0019 features a secondary 0.3-megapixel visible light camera. The software allows users to overlay the thermal image onto the standard visual photo at varying opacities (0%, 25%, 50%, 75%, 100%). This provides context—showing the outline of a light switch or a door frame—so you know exactly where the thermal anomaly is located physically.

Conclusion: From Reactive to Proactive
The shift from reacting to disasters to preventing them is the core value of home thermal imaging. While professionals have long used expensive rigs, the availability of 320x240 resolution sensors in accessible devices like the PerfectPrime IR0019 has changed the landscape for homeowners. By understanding the basics of resolution, Delta T, and emissivity, you can transform a simple “heat camera” into a powerful diagnostic instrument, saving significantly on energy bills and structural repairs over the life of a home.
For a practical demonstration of how thermal imaging uncovers electrical issues, check out this guide on inspecting electrical panels.
This video is relevant because it visually demonstrates the “hotspot” concepts discussed above, showing exactly how resistance appears on a thermal camera screen in a real-world scenario.