Pilipane Thermal Imager Infrared Camera: Unveiling the Unseen World of Heat for Home & Beyond
Update on April 24, 2025, 9:04 a.m.
Have you ever stood baffled by a persistent cold spot in your living room, even with the heating on full blast? Or perhaps cautiously hovered your hand near an electrical outlet, wondering if that faint warmth is normal or a sign of trouble brewing within the walls? We live surrounded by invisible clues, subtle shifts in temperature that hint at hidden problems – drafts stealing our expensive heat, insulation failing in its duty, moisture lurking where it shouldn’t, or circuits working dangerously hard. If only we could see this hidden world of heat.
Well, what if I told you that we can? Welcome to the fascinating realm of thermal imaging, a technology that gifts us a kind of sixth sense, allowing us to perceive the infrared energy that constantly radiates from everything around us. It’s like stepping into a parallel visual reality where the language is temperature. Tools like the Pilipane Thermal Imager Infrared Camera (the specific device we’ll use as our learning example today, based on its provided description) aim to make this powerful capability accessible. But to truly wield this power, we need to understand the science that makes it possible. So, let’s embark on a journey together, exploring the invisible landscape of heat.

A Serendipitous Discovery: When Sunlight Revealed More Than Colors
Our story begins not with sophisticated electronics, but over two centuries ago, with a curious astronomer named William Herschel. In the year 1800, Herschel was experimenting with sunlight and prisms, investigating the temperature of different colors of light. He used thermometers placed in each color band projected by the prism. As expected, temperatures varied across the visible spectrum. But then, out of sheer curiosity, he placed a thermometer beyond the red end of the spectrum, where no visible light fell. To his astonishment, this thermometer registered the highest temperature of all!
Herschel had accidentally stumbled upon a form of light invisible to the human eye, carrying significant heat energy. He called it “calorific rays”; we now know it as infrared radiation. This chance discovery opened the door to understanding that there’s more to light than meets the eye, and that heat itself travels as a form of electromagnetic wave. It was the first crucial step towards eventually being able to visualize this invisible energy.
The Invisible Glow: Understanding Infrared Energy Around Us
So, what exactly is this infrared radiation Herschel found? Think of the electromagnetic spectrum as a vast family of waves, ranging from radio waves at one end to gamma rays at the other. Visible light, the rainbow of colors we see, occupies only a tiny sliver of this spectrum. Infrared radiation sits just next to red light, with longer wavelengths.
Here’s the truly amazing part: every object with a temperature above absolute zero (-273.15°C or -459.67°F) constantly emits infrared radiation. Yes, everything – you, your coffee cup, the chair you’re sitting on, the walls of your house – is perpetually “glowing” in infrared. This glow isn’t caused by reflected light like vision; it’s generated by the vibration of atoms and molecules within the object itself. The hotter the object, the more its atoms vibrate, and the more intense its infrared emission. It’s the universe’s way of broadcasting temperature information. Thermal cameras are ingeniously designed to capture and translate this invisible broadcast into a picture our eyes can understand.

How Do We Possibly “See” Heat? Peeking Inside the Thermal Camera
Capturing invisible light sounds like magic, but it relies on clever physics and engineering. At the core of most modern thermal imagers, including likely the type used in the Pilipane device featuring the specified MLX90640ESF-BAB sensor, is a component called a microbolometer array.
Imagine a microscopic grid, like an ultra-fine checkerboard. Each tiny square on this grid is a “pixel,” but instead of detecting color, it’s designed to absorb infrared radiation. When infrared energy hits one of these micro-pixels, it warms up ever so slightly. This change in temperature causes a measurable change in the pixel’s electrical resistance. The camera’s electronics detect these tiny resistance changes across the entire grid, square by square.
Think of it like having thousands of incredibly sensitive, miniature thermometers packed tightly together. Each one measures the “heat intensity” hitting its specific spot. The camera then processes this grid of temperature data, assigning different colors or shades of grey to different temperature values. Voilà! An invisible heat map is translated into a visible image, often called a thermogram, displayed on the camera’s screen. Hotter areas might appear as white, yellow, or red, while cooler areas show up as blue, purple, or black, depending on the chosen color palette (though the provided description for the Pilipane doesn’t specify palette options).

Making Sense of the Specs: What the Numbers Really Mean
Now that we grasp the basic science, let’s look at the specifications listed for the Pilipane Thermal Imager. Understanding these numbers is crucial for knowing what the tool can realistically do. (Crucially, please remember all specific product data mentioned below is derived solely from the provided product description text.)
The Pixel Puzzle: Why Resolution is Key (32x24 Sensor Deep Dive)
Perhaps the most critical specification for any imaging device is resolution. The description states the Pilipane imager has a hardware resolution (the sensor itself) of 32x24 pixels. This means the microbolometer array, our grid of tiny thermometers, consists of 32 columns and 24 rows, totaling 768 individual thermal sensors. This number defines the fundamental level of detail the camera can capture from the thermal world. Each pixel represents one temperature reading from a small area of the scene being viewed.
Now, you might notice the description also mentions a screen resolution of 320x240 pixels for its 2.8-inch LCD. Why the difference? The larger screen resolution doesn’t magically increase the amount of thermal data captured. Instead, the camera takes the original 768 thermal data points and upscales or interpolates them to fill the larger screen. Think of it like taking a small, slightly blurry photograph and enlarging it – the picture gets bigger, but it doesn’t gain any new detail; existing details just get stretched or averaged out.
What does this 32x24 resolution mean in practice? It’s considered an entry-level thermal resolution. It won’t provide sharp, detailed thermal photographs like high-end cameras used for professional building diagnostics or scientific research. Fine details, like a small crack letting in a tiny air leak or subtle temperature variations across a complex circuit board, might be missed or blurred together.
However, it doesn’t mean the tool is useless! A 32x24 sensor is often perfectly adequate for identifying larger patterns and significant temperature differences. Think about: * Spotting the overall cold zone around a poorly sealed window frame. * Seeing a large patch of missing insulation in an attic. * Detecting a noticeably overheating electrical breaker in a panel (viewed from a safe distance). * Finding a major hot or cold spot on an HVAC duct.
It excels at revealing the big picture of thermal anomalies, even if the fine print is fuzzy. Understanding this distinction between sensor resolution and its practical implications is key to using such a device effectively.

From Freezing to Sizzling: Temperature Range & Accuracy (-40°C to 300°C, ±2°C)
The description specifies a broad temperature measurement range from -40°C to +300°C (-40°F to 572°F). This wide span covers most temperatures encountered in typical home, automotive, or hobbyist scenarios – from checking freezer performance or outdoor winter drafts to looking at engine components or cooking surfaces (though caution is advised near very high heat).
The stated measurement accuracy is ±2°C. This means that under ideal conditions (correct emissivity setting, stable environment, within optimal distance), the temperature reading displayed should be within 2 degrees Celsius of the actual surface temperature. Is this accurate enough? For identifying significant problems like a 15°C cold spot near a door or a component running 30°C hotter than its neighbours, yes, absolutely. It’s designed for diagnostic comparison – finding the anomalies – rather than for high-precision scientific measurement where fractions of a degree might matter.
The Surface Speaks: Understanding Emissivity (0.95 Setting)
This is a fascinating and crucial concept! Remember how objects emit infrared radiation based on their temperature? Well, how effectively they emit that radiation depends on their surface properties. This efficiency is called emissivity, measured on a scale from 0 to 1. A perfect emitter (a theoretical “blackbody”) has an emissivity of 1, while a perfect reflector (like a mirror) has an emissivity close to 0.
Think of it like this: imagine different people shouting in a room. Some have loud voices (high emissivity), others are quiet (low emissivity). A thermal camera is like someone listening in the room – it more easily “hears” (detects radiation from) the loud shouters.
Most dull, non-metallic surfaces – like wood, paint, drywall, rubber, skin – have high emissivity, typically around 0.90 to 0.98. The Pilipane imager description notes an emissivity setting of 0.95. This is a good general-purpose setting for many common materials found in homes.
However, shiny surfaces, especially metals (like bare copper, polished steel, aluminum foil), have very low emissivity. They are poor emitters and tend to reflect the infrared radiation from their surroundings (including your own body heat!). Trying to measure the temperature of a shiny metal surface with a thermal camera set to 0.95 will likely give you a wildly inaccurate reading – it’s measuring more reflected heat than emitted heat. While the provided description doesn’t state if the 0.95 setting is adjustable, it’s vital to be aware of this phenomenon. For accurate readings on diverse surfaces, adjustable emissivity is usually required; for a fixed setting, focus measurements on non-shiny materials or apply matte tape/paint to shiny spots if precise measurement is needed (and possible).
Capturing the Flow: Refresh Rate & Field of View (8Hz, 55°x35°)
The refresh rate tells us how many times per second the thermal image updates on the screen. The Pilipane device is listed at 8Hz. This means the image refreshes 8 times every second. For scanning static scenes like walls or ceilings, or looking at stationary objects, 8Hz generally provides a reasonably smooth viewing experience. However, if you pan the camera quickly or try to observe rapidly changing temperatures, you might notice some lag or motion blur compared to cameras with higher refresh rates (e.g., 30Hz or 60Hz).
The Field of View (FOV), specified as Horizontal 55° x Vertical 35°, describes the angular extent of the scene captured by the camera lens. Imagine holding a flashlight – the FOV is like the angle of the cone of light it projects. A 55° horizontal view is relatively wide, allowing you to see a good portion of a wall or room without having to stand too far back, making it convenient for scanning larger areas quickly.
Beyond the Core Specs: Features for the Field
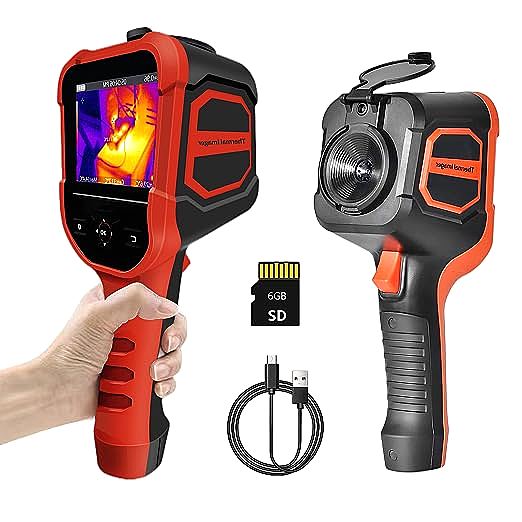
Beyond the main imaging specifications, the description mentions several practical features that support usability: * Battery Life: A built-in lithium-ion battery providing ≥4 hours of working time allows for decent operational periods away from a power source. * Charging: Convenient USB Type C charging is standard now. The description also notes it can be used while charging, which is handy. * Image Storage: The ability to store 100 pictures internally (on a built-in SPI Flash chip) is useful for documenting findings during an inspection. * Data Transfer: A USB cable allows transferring these stored images to a computer or phone for reporting or further analysis. * On-Screen Info: The display tracks the highest, lowest, and center temperatures within the scene automatically, helping to quickly identify points of interest. * Build: A case made from FR4 epoxy sheet is mentioned for durability. The compact, handheld design facilitates one-handed operation.
Thermal Vision in Action: Uncovering Secrets in Your Home
Now, let’s bring this all together. How could you actually use a tool like this (keeping its capabilities and limitations in mind) around your home?
- The Draft Detective: Slowly scan around window frames, door seals, electrical outlets on exterior walls, and where walls meet the floor or ceiling. Even with 32x24 resolution, a significant cold air leak will often appear as a distinct cool plume or area (typically blue or purple) compared to the warmer surrounding wall (perhaps yellow or green). Following this cool signature can lead you straight to the source of the draft.
- Insulation Investigator: Scan ceilings below attics or large sections of exterior walls. Look for inconsistent patterns. Uniformly insulated areas should show a relatively even temperature. Large cooler patches in winter (or hotter patches in summer) could indicate areas where insulation is missing, compressed, or ineffective. You’re looking for the contrast, the deviation from the norm.
- Moisture Clue Hunter (Indirectly): While thermal imagers don’t directly detect moisture, wet materials often change temperature differently than dry ones due to evaporation (usually appearing cooler). Scanning walls near plumbing fixtures, under windows, or on ceilings after rain might reveal suspicious cool spots that warrant further investigation with a moisture meter. It’s an indirect clue, but a powerful one.
- Electrical Safety Check (With Extreme Caution!): Safety First! Never open electrical panels unless you are qualified. From a safe distance, you can scan the closed breaker panel door, outlets, and light switches. Look for any component that appears significantly hotter than others like it. An unusually warm breaker or outlet could indicate a loose connection or overload, a potential fire hazard that needs professional attention immediately. Again, you’re looking for the anomaly.
Reading Between the Colors: Basic Interpretation & Knowing Your Tool’s Limits
Interpreting thermograms is a skill, but here are some basic principles:
- Focus on Differences (Delta T): Often, the absolute temperature isn’t as important as the difference in temperature between an object and its surroundings, or between similar components. A 5°C difference might be significant for an electrical connection, but negligible for a wall surface.
- Look for Patterns: Is the temperature uniform where it should be? Are there unexpected lines, blobs, or gradients? Patterns often tell a story (e.g., the regular pattern of studs behind drywall, or an irregular cold splotch indicating a problem).
- Understand Low-Resolution Imagery: Remember the 32x24 limitation. Don’t expect sharp details. Look for broader areas of interest. What might look like one blurry cold spot could be several small leaks clustered together. Use the thermal image to guide you to areas needing closer, perhaps physical, inspection.
- Mind the Surface (Emissivity!): Be highly skeptical of temperature readings from shiny, unpainted metal surfaces. They are likely reflecting the temperature of something else (maybe you!). Focus your quantitative interpretations on dull, non-reflective surfaces.
- Context is King: Consider the time of day, recent weather, and how the HVAC system is operating. A wall might appear cool simply because the sun hasn’t hit it yet. Interpretation requires combining the thermal data with common sense and other information.
Conclusion: A New Perspective, An Empowered Observer
Stepping into the world of thermal imaging is like gaining a superpower – the ability to see the invisible energy that shapes our comfort, safety, and energy efficiency. From Herschel’s curious thermometer to accessible handheld devices like the Pilipane imager described here, the journey of harnessing infrared vision has been remarkable.
As we’ve explored, understanding the science behind the specifications – the pixel grid of the sensor, the dance of emissivity, the meaning of accuracy and refresh rate – is what transforms a gadget into a truly useful diagnostic tool. While entry-level imagers with resolutions like 32x24 pixels have their limitations in terms of fine detail, they absolutely can empower you to spot significant thermal patterns, identify potential problems, and make more informed decisions about maintaining your home or checking equipment, provided you interpret the images wisely and understand the tool’s capabilities.
Ultimately, thermal imaging isn’t just about finding problems; it’s about gaining a deeper understanding of the physical world around us, a world constantly radiating stories told in the language of heat. By learning to read that language, even with simple tools, we become more perceptive, more proactive, and more empowered observers.